 To Flourish: to “grow or develop in a healthy or vigorous way, especially as the result of a particularly congenial environment.” -The Oxford Dictionary Online
“The greatest management principle in the world is: the things that get rewarded and appreciated get done.”
– Michael LeBoeuf
Principle 3 of Nevinomics states that the rules we set – how we construct the economy – depends on what we are trying to accomplish.
So what is the economy for?
Nevinomics believes that our neglect of this fundamental question is the most important reason that orthodox economic approaches to public policy have failed to provide sufficient improvements in most people’s lives in the developed world of the past 30 years.
Nevinomics has chosen maximizing individual Flourishing as the objective of the economy because I believe that focusing on Flourishing – measuring it and developing policies and structures that increase it – promises to have the greatest positive impact on people’s lives and to ensure that the economy we construct serves society as a whole. I owe the reader an explanation of this choice, which requires not only elaborating on Flourishing but also explaining alternatives, including the current GDP-focused orthodoxy. This article discusses some of the alternatives to GDP and a subsequent article examines Flourishing in more detail.
It is obvious to any casual observer that maximizing GDP and GDP growth has become the policy maker’s key economic objective everywhere on the planet. On a daily basis, we are barraged with numbers showing strong GDP growth, weak GDP growth, negative GDP growth. The fate of the markets and the fate of governments rides on a few tenths of a percent difference. Indeed, I also succumb to this orthodoxy when I tell clients and audiences that 6 of the 10 fastest growing economies are in sub-Saharan Africa.
And there is a lot to recommend GDP, GDP growth, and GDP per capita. With a single metric, we have found a way to aggregate all our economic activity; growing GDP can indeed be a tide that lifts all boats; and high levels of GDP are correlated with one critical feature of Flourishing – people who want employment can find it.
At the same time, however, there is an increasing disquiet about treating GDP as the most important metric, and more and more key influencers1)Reference to Sarkozy/Stiglitz commission on replacing GDP are starting to question the laser focus we have on GDP. Here are 3 obvious concerns:
-
Measurement – If the British NHS (National Health Service) overpays Pfizer for a pharmaceutical, GDP goes up (and of course government borrowing goes up). If Canadian Oil Sands production soars – at the expense of huge incremental carbon releases and ground pollution, as well – GDP goes up with no appropriate accounting for environmental damage. If a woman goes out to work and hires a caregiver for her own children – spending all she earns to pay the caregiver – GDP goes up. Intuitively, in all these examples, well-being has declined, so a metric that shows we are worse off will be the right way to measure how well we are doing.
-
Equity – In the past, when wage increases matched productivity growth in the US and Europe, GDP and GDP per capita may have been good proxies for well-being. But in the past 30 years, these have decoupled. Figure 1 shows this dramatically, indexing productivity, real median income, and GDP per capita in 1973 to 100. Real median hourly income has increased 10.7% in total from 1973 to 2011 or less than 0.3% per year. For men, as the graph shows, the median income has increased 0.1% in total, or to put this another way, has not increased at all. In the same period, productivity has increased 80% or 1.6% per year.2)Pedro Da Costa, “The U.S. Productivity Farce,” Reuters Online, Accessed January 2nd, 2014, Productivity Farce. Presumably, we use GDP because it is a good overall metric of broad progress. But if GDP can increase without this increase being translated into an increase in broad prosperity, then the measure stops being useful.
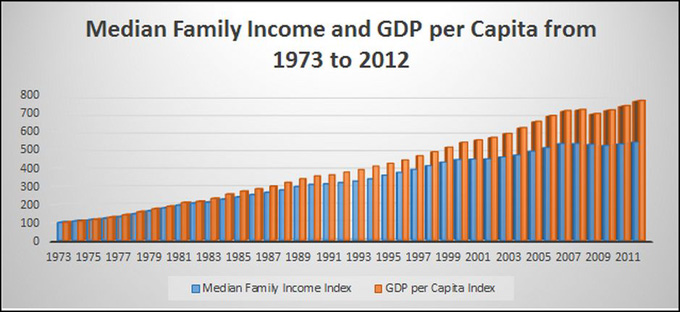
Figure 1:The Comparison Between Family Income Growth and GDP per Capita Growth3)Davemanuel.com, “Median Household Income in the United States,” Median Household Income.
-
Relevance – Economic orthodoxy tells us that as one gets richer, marginal gains in income get smaller and smaller. We are undoubtedly richer than 50, 100, 500 years ago. So does this old metric truly capture what matters in a world in which the addition of one more material object, to a developed nation, is essentially meaningless? At the end of the day, money isn’t everything, and as we become richer, it means less and less. As I said in my doctoral thesis: “Man is a meaning-endowing animal. Objects, activities, and rituals all become infused with an importance beyond their purely physical characteristics… Actions require reasons. Reasons require meanings.”4)From my doctoral thesis, 123. In effect, we have progressed. The economy has changed. So why would we expect the same measures of economic progress to guide our policy making in 2014 as did in 1963?
There are enough known problems with the GDP metric that it is disconcerting that more progress has not been made toward adopting alternatives. The Sen-Stiglitz-Fitoussi report – commissioned by then-President Sarkozy of France – comprehensively laid out these problems in Mismeasuring Our Lives: Why GDP Doesn’t Add Up.5)Joseph E. Stiglitz, Amartya Sen and Jean-Paul Fitoussi, Mismeasuring Our Lives: Why GDP Doesn’t Add Up, Commission on the Measurement of Economic Performance and Social Progress (France, 2010). The report is devastating. In a nutshell, we measure the wrong things about the economy, and so we cannot get what we need from the economy. Unfortunately, because the report was written in a dense and impenetrable style – and Sarkozy of course was voted out of office – it has not had the impact it should have, given the importance of the issue and the conclusions reached.
As Nevinomics states from the outset, the objective of the economy is Flourishing, and so the measurement of the economy’s success needs to reflect that goal. Toward providing the explanation of why Flourishing, let’s first examine a few of the alternatives.
The Genuine Progress Indicator (GPI) attempts to fill these gaps with 2 types of adjustments: (i) adjusting for the true value of activities and (ii) measuring reductions in future productive capacity resulting from consuming our natural or man-made capital. An example from the first category, crime and the potential for crime, is a cost. Under current GDP standards, when we spend on security to avoid crime, this is counted as an increase in GDP, which cannot be right. In the second category, we need to account for using non-renewable resources. We could increase Canada’s GDP 10-fold next year if we extracted all the available hydro-carbons from the oil sands. Surely, though, this cannot be right, and what we measure needs also to capture the balance sheet effects of using up non-renewable resources.
In its most detailed form, GPI provides tremendous granularity between human activities that are welfare enhancing and those that are welfare destroying. It starts with GDP and makes the following adjustments:
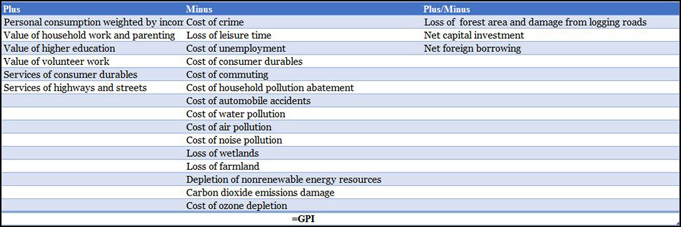 Figure 2: GPI Adjustments to GDP
GPI does address many of the defects of GDP.
In a recent update, new features have been added, including an adjustment for income inequality. As Talberth, Cobb, and Slatterly6)Dr. John Talberth, Clifford Cobb and Noah Slattery, The Genuine Progress Indicator 2006: A Tool for Sustainable Development. PDF file. Accessed October 8, 2013. GPI Indicator 2006. put it:
There is strong empirical evidence that rising income inequality hinders growth in economic welfare (Hsing, 2005). A highly unequal distribution of income can be detrimental to economic welfare by increasing crime, reducing worker productivity, and reducing investment. Moreover, when growth is concentrated in the wealthiest income brackets it counts less towards improving overall economic welfare because the social benefits of increases in conspicuous consumption by the wealthy are less beneficial than increases in spending by those least well off.
There is also an interesting conceptual question about the value of higher education – is it an investment in genuine skills, a method (wasteful, like a peacock’s tail) to signal fitness for the job market or for a mate, or a consumption good in itself that adds value to one’s life and community? Talberth, Cobb, and Slatterly come down on the last of these, citing a study by Hill et al that suggests that higher education does indeed add value.7) Talberth et al, Genuine Progress: “Hill et al. (2005) provide an exhaustive list of such benefits, which are both monetary and non-monetary and in the form of increases in the stock of knowledge, productivity of workers and capital, civic participation, job market efficiency, savings rates, research and development activities, charitable giving, and health. Based partially on Moretti (2004) they estimate the total value of this social spillover effect to be $16,000 per year per college-educated worker. We multiplied this value by the number of people 25 years and older that had completed at least four years of college as reported in periodic U.S. Census Bureau Current Population Surveys. In 2004, we estimate the annual social benefits of higher education to be nearly $828 billion. This represents the GPI’s second largest addition to personal consumption expenditures.”
Overall, GPI is a significant improvement on GDP as a measure of overall social welfare. Unfortunately, it has not been more widely adopted as a mainstream objective, as empirical evidence has shown that there has been a divergence in recent decades between GDP and GPI growth, mirroring the growing perception that even though developed nations’ GDPs continue to increase, life is not getting better:
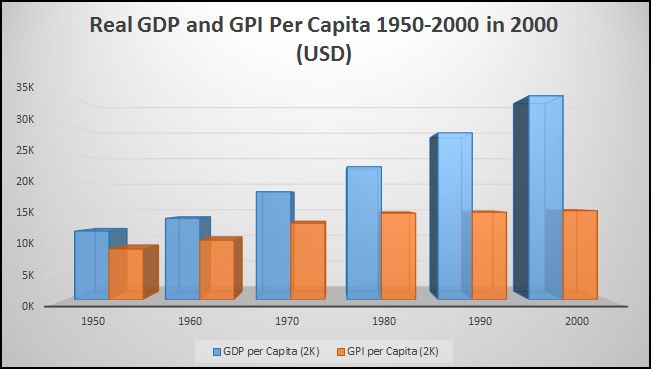
Figure 3: Real GDP and GPI Per Capita: Reproduced from Talberth et al8)Dr. John Talberth, Clifford Cobb and Noah Slattery, The Genuine Progress Indicator (2006,) Accessed November 14, 2013.
Indeed, this graph is extremely worrying. What it says essentially is that despite the tremendous improvements in technology and business models from 1970 to 2000, life is not much better in the US – Genuine Progress has not been made. Nevinomics believes this to be very poor performance indeed. Interestingly, I began my PhD in Economics at Harvard in 1981. This roughly coincides with the beginning of the massive divergence between GDP and GPI. Up until that point, economists could rightly point to the remarkable economic performance of the post WWII period in developed nations and its positive impact on individual lives. From the perspective of Harvard’s Economics department in 1981 it was inconceivable that this progress was about to come to a halt. But this is what happened.
Beyond these purely statistical measures, progress has been made with subjective evaluations of well-being. As is well known, the concept of Gross National Happiness9)Bhutan 2008, Gross National Happiness: Development Philosophy of Bhutan, Accessed October 20, 2013, Bhutan National Happiness. (GNH) was introduced in 1972 by Bhutan’s’s fourth Dragon King, Jigme Singye Wangchuck. GNH is embedded into the economic planning processes of Bhutan and new policies must pass a GNH review. Bhutan has also been on the leading edge of developing specific survey-based methodologies to measure happiness.
Interestingly, Canada has often been at the forefront of the development of the GNH methodology, with Michael Pennock10) Robert Constanza and Al Jazeera, The Pursuit of Happiness, Accessed October 20, 2013, Pursuit of Happiness. playing an important role in the construction of Bhutan’s index and the city of Victoria (British Columbia) being one of the first explicitly to measure the happiness of its people.
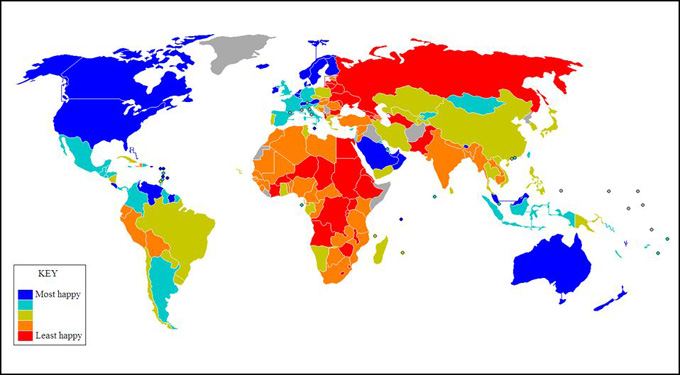 Figure 4: A visual representation of the results of happiness surveys11)Adrian White, “A Global Projection of Subjective Well-being: A Challenge To Positive Psychology?” Accessed November 8, 2013, Subjective Well-Being.
The usual suspects are the most happy – the Nordic countries (the banking catastrophe in Iceland does not seem to have dented its performance here), Canada, US, Australia, and Ireland. But the big European countries (Germany, France, Spain, and the UK) fare more poorly and, surprisingly (and distressingly to me), Japan fares even worse.
While big parts of sub-Saharan Africa are in the lowest category, Nigeria is off the bottom, which fits with my personal experience, while a few very bright spots (Namibia, Ghana, Madagascar, and Gabon) make it into the middle group.
Russia, which fared extremely poorly in the empirical Flourishing work that has been done (my Flourishing research shows Russia is 9%) reproduces a similarly poor result here.
Finally, on this measure, there are countries such as Malaysia, Saudi Arabia,12)Saudi Arabia is the world’s largest oil exporter, but because of a relatively large population versus other oil-exporting nations, its GDP is quite low and it only ranks as a middle income country. Costa Rica, and Colombia that are not rich, and not traditionally thought of as economically strong, but that are doing extremely well. Is this an en example of Marx’s false consciousness? Perhaps Nevinomics will be able to answer this in due course.
Following on the Stiglitz-Sen-Fitoussi Report,13)See note 5, above. both the UK and France have started initiatives to consider well-being in their explicit planning.
Finally, as an interesting aside, the Happy Planet Index has been designed to see which countries get the most for the least in the sense of the longer life and higher experienced well-being per unit of ecological footprint. In effect, HPI measures who is the most efficient at getting the most for the least – perhaps it could be considered the purest measurement of the quality of an economy, as it explicitly considers the resources that go in to get the result.14)Economics is often defined as ‘Economics examines how people use their scarce resources in an attempt to satisfy their unlimited wants. Unlimited Wants. The winners here really do have a legitimate claim to having the best economies.
So who wins on the Happy Planet Index? Costa Rica, Vietnam, and Colombia. The US ranks 105th, and, of the G7, the best performance comes from Japan at a very poor 45th!15)Abdallah S, Michaelson J, Shah S, Stoll L, Marks N (2012) The Happy Planet Index: 2012 Report. A global index of sustainable well-being, Accessed May 25, 2014, Happy Planet Index. Basically, the advanced economies are extremely wasteful and do not get much life expectancy or well-being for the enormous amount of natural resources they invest.
Of course, standing back, all of these types of Happiness/Well-being measures suffer from the obvious criticism: they are subjective and survey-based, or, as McCloskey16)Deirdre N. Mccloskey, Happyism: The creepy new economics of pleasure, Accessed October 20, 2013, Happyism. scathingly puts it:
Recording the percentage of people who say they are happy will tell you something, to be sure, about how people use words. It’s worth learning. We cannot ever know whether your experience of the color red is the same as mine, no matter how many brain scans we take… What we can know is neither objective nor subjective, but (to coin a word) “conjective.” It is what we know together in our talk, such as our talk about our happiness. Con-jective: together thrown. No science can be about the purely objective or the purely subjective, which are both unattainable.
Nevinomics agrees that Happiness is an uneasy objective but most importantly for a different reason: it is a byproduct of other activities, never an end in itself, so aiming for happiness is ultimately self-defeating. This concept was discussed at length in my original PhD thesis: “…the objectives that most deeply touch one’s life seem to be precisely those least amenable to direct pursuit.”17) Nevin, Thesis, 127. I do not claim any originality for this insight. It has been well discussed by many philosophers since Ancient Greek. Jon Elster provides a good discussion in “States that Are Essentially By-Products,” the second chapter of Sour Grapes: Studies in the Subversion of Rationality (Cambridge: Cambridge University Press, 1985,) 43-101. So, 3 concepts to measure the performance of our economy, each a significant advance over GDP. But Nevinomics does not choose any of them as the objective. Why? Because to do so would be to go at this backwards. The solution is not to take the existing GDP measures, recognize their faults, and start to make adjustments to what we measure. The solution – per Principle 4 of Nevinomics: To arrive at the best rules we can to achieve society’s objectives, we need to take account of Realities about people – is to understand what matters in our lives and to build our measurement of the economic system from this perspective. Maximizing Flourishing has been chosen because – in my experience – to Flourish is the essence of what it means to alive and to live a good life, an essence that has been understood and examined by philosophers for millennia. In the next article, we will explore more fully what this means.

Footnotes
| 1. | ↑ | Reference to Sarkozy/Stiglitz commission on replacing GDP |
| 2. | ↑ | Pedro Da Costa, “The U.S. Productivity Farce,” Reuters Online, Accessed January 2nd, 2014, Productivity Farce. |
| 3. | ↑ | Davemanuel.com, “Median Household Income in the United States,” Median Household Income. |
| 4. | ↑ | From my doctoral thesis, 123. |
| 5. | ↑ | Joseph E. Stiglitz, Amartya Sen and Jean-Paul Fitoussi, Mismeasuring Our Lives: Why GDP Doesn’t Add Up, Commission on the Measurement of Economic Performance and Social Progress (France, 2010). |
| 6. | ↑ | Dr. John Talberth, Clifford Cobb and Noah Slattery, The Genuine Progress Indicator 2006: A Tool for Sustainable Development. PDF file. Accessed October 8, 2013. GPI Indicator 2006. |
| 7. | ↑ | Talberth et al, Genuine Progress: “Hill et al. (2005) provide an exhaustive list of such benefits, which are both monetary and non-monetary and in the form of increases in the stock of knowledge, productivity of workers and capital, civic participation, job market efficiency, savings rates, research and development activities, charitable giving, and health. Based partially on Moretti (2004) they estimate the total value of this social spillover effect to be $16,000 per year per college-educated worker. We multiplied this value by the number of people 25 years and older that had completed at least four years of college as reported in periodic U.S. Census Bureau Current Population Surveys. In 2004, we estimate the annual social benefits of higher education to be nearly $828 billion. This represents the GPI’s second largest addition to personal consumption expenditures.” |
| 8. | ↑ | Dr. John Talberth, Clifford Cobb and Noah Slattery, The Genuine Progress Indicator (2006,) Accessed November 14, 2013. |
| 9. | ↑ | Bhutan 2008, Gross National Happiness: Development Philosophy of Bhutan, Accessed October 20, 2013, Bhutan National Happiness. |
| 10. | ↑ | Robert Constanza and Al Jazeera, The Pursuit of Happiness, Accessed October 20, 2013, Pursuit of Happiness. |
| 11. | ↑ | Adrian White, “A Global Projection of Subjective Well-being: A Challenge To Positive Psychology?” Accessed November 8, 2013, Subjective Well-Being. |
| 12. | ↑ | Saudi Arabia is the world’s largest oil exporter, but because of a relatively large population versus other oil-exporting nations, its GDP is quite low and it only ranks as a middle income country. |
| 13. | ↑ | See note 5, above. |
| 14. | ↑ | Economics is often defined as ‘Economics examines how people use their scarce resources in an attempt to satisfy their unlimited wants. Unlimited Wants. |
| 15. | ↑ | Abdallah S, Michaelson J, Shah S, Stoll L, Marks N (2012) The Happy Planet Index: 2012 Report. A global index of sustainable well-being, Accessed May 25, 2014, Happy Planet Index. |
| 16. | ↑ | Deirdre N. Mccloskey, Happyism: The creepy new economics of pleasure, Accessed October 20, 2013, Happyism. |
| 17. | ↑ | Nevin, Thesis, 127. I do not claim any originality for this insight. It has been well discussed by many philosophers since Ancient Greek. Jon Elster provides a good discussion in “States that Are Essentially By-Products,” the second chapter of Sour Grapes: Studies in the Subversion of Rationality (Cambridge: Cambridge University Press, 1985,) 43-101. |


